Retail Intelligence Platform
Eighteen years of weekly store visits. 360 retailers. 57 seasonal events. The largest proprietary retail image archive in the UK, with twelve connected AI models that turn it into competitive intelligence.
Or talk to us about your use case.
The Archive
Proprietary weekly-captured imagery since 2009. Not scraped. Not licensed. Purpose-captured by a team that has been in UK retail stores every single week — covering grocery, general merchandise, and clothing. Cluttered shelves, bad lighting, obstructed views, COVID-era empty aisles. Real retail as it actually is, which is why our models work in production, not just in demos. The 2009–2020 data no longer exists anywhere else.
Connected Intelligence
Most retail AI tools work in isolation. Fix an error in one model and the others never learn. Kanops connects every model through a shared feedback loop. A single correction ripples across all twelve models instantly — millions of cross-learning entries and counting.
Every correction flows through a unified audit trail. Nothing is lost, nothing is siloed.
When one model learns something, the others benefit automatically. A correction in one context enriches another with zero additional effort.
Every client interaction improves the platform for all clients. Most software ships and stays the same. Kanops compounds with every correction.
Delphi — Shipping Now
Ask questions in plain English. Compare any retailer across any seasonal event and any year. Plan campaigns with 364,000 images of observed in-store execution — Easter, Christmas, Back to School, Father’s Day, and 53 more. Eight connected AI models extract pricing, category mix, and competitive timing at scale.
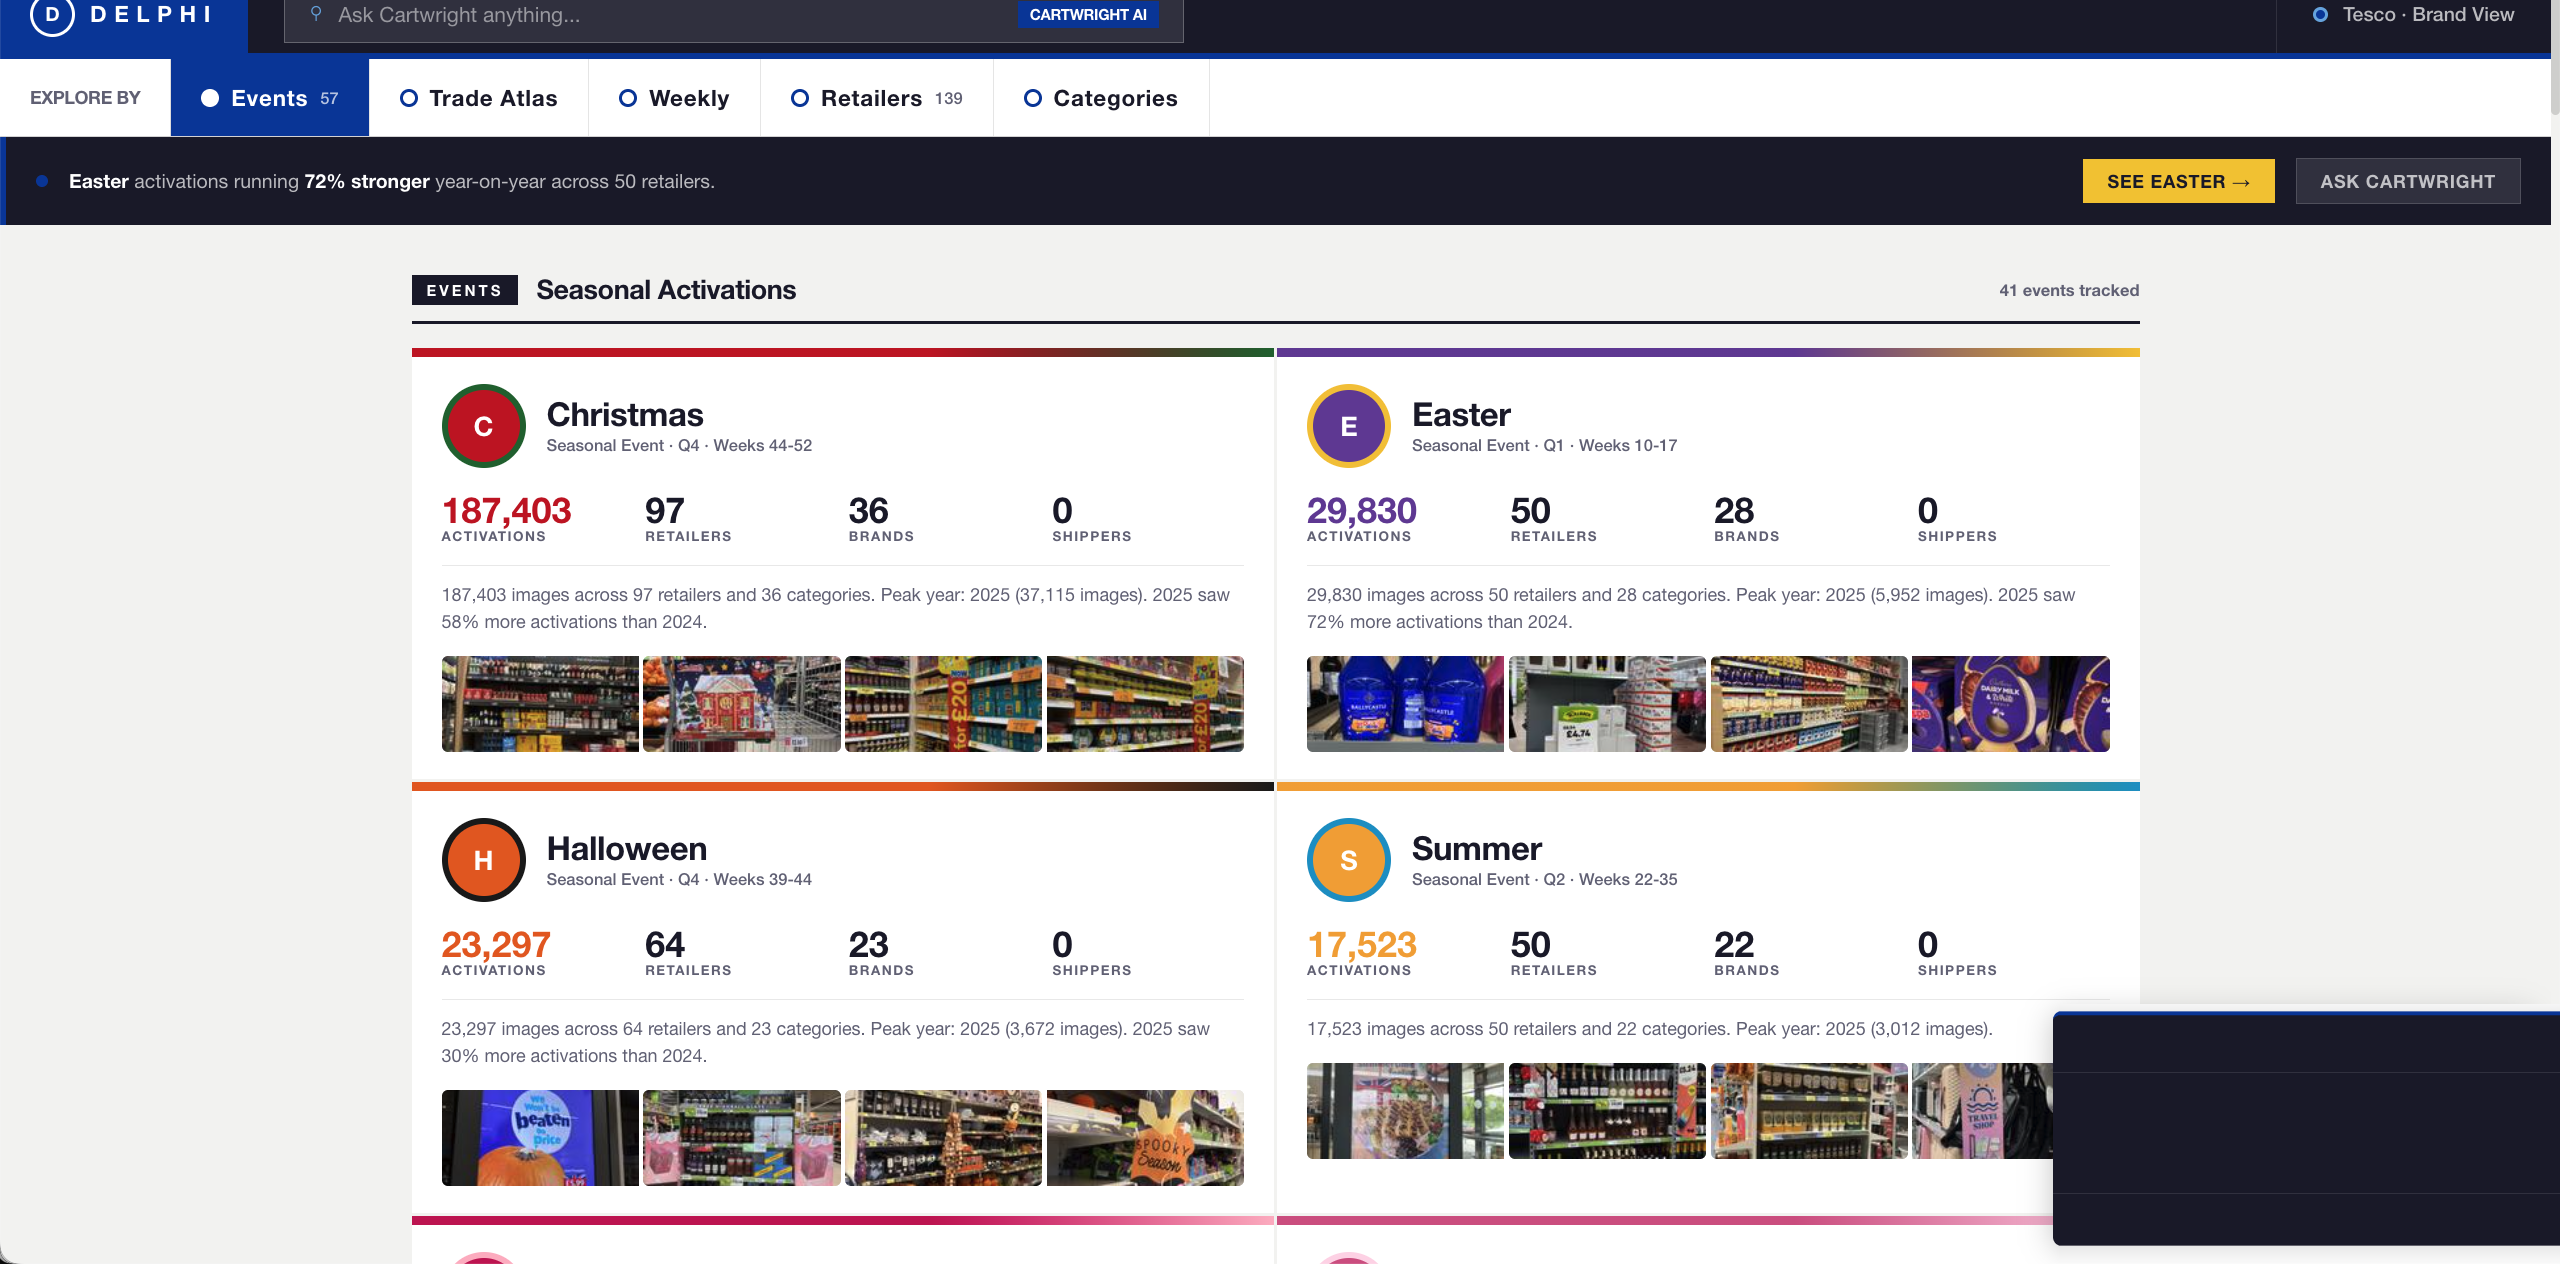
Browse 57 seasonal events with real-time activation data, retailer counts, brand coverage, and preview imagery from 18 years of store visits.
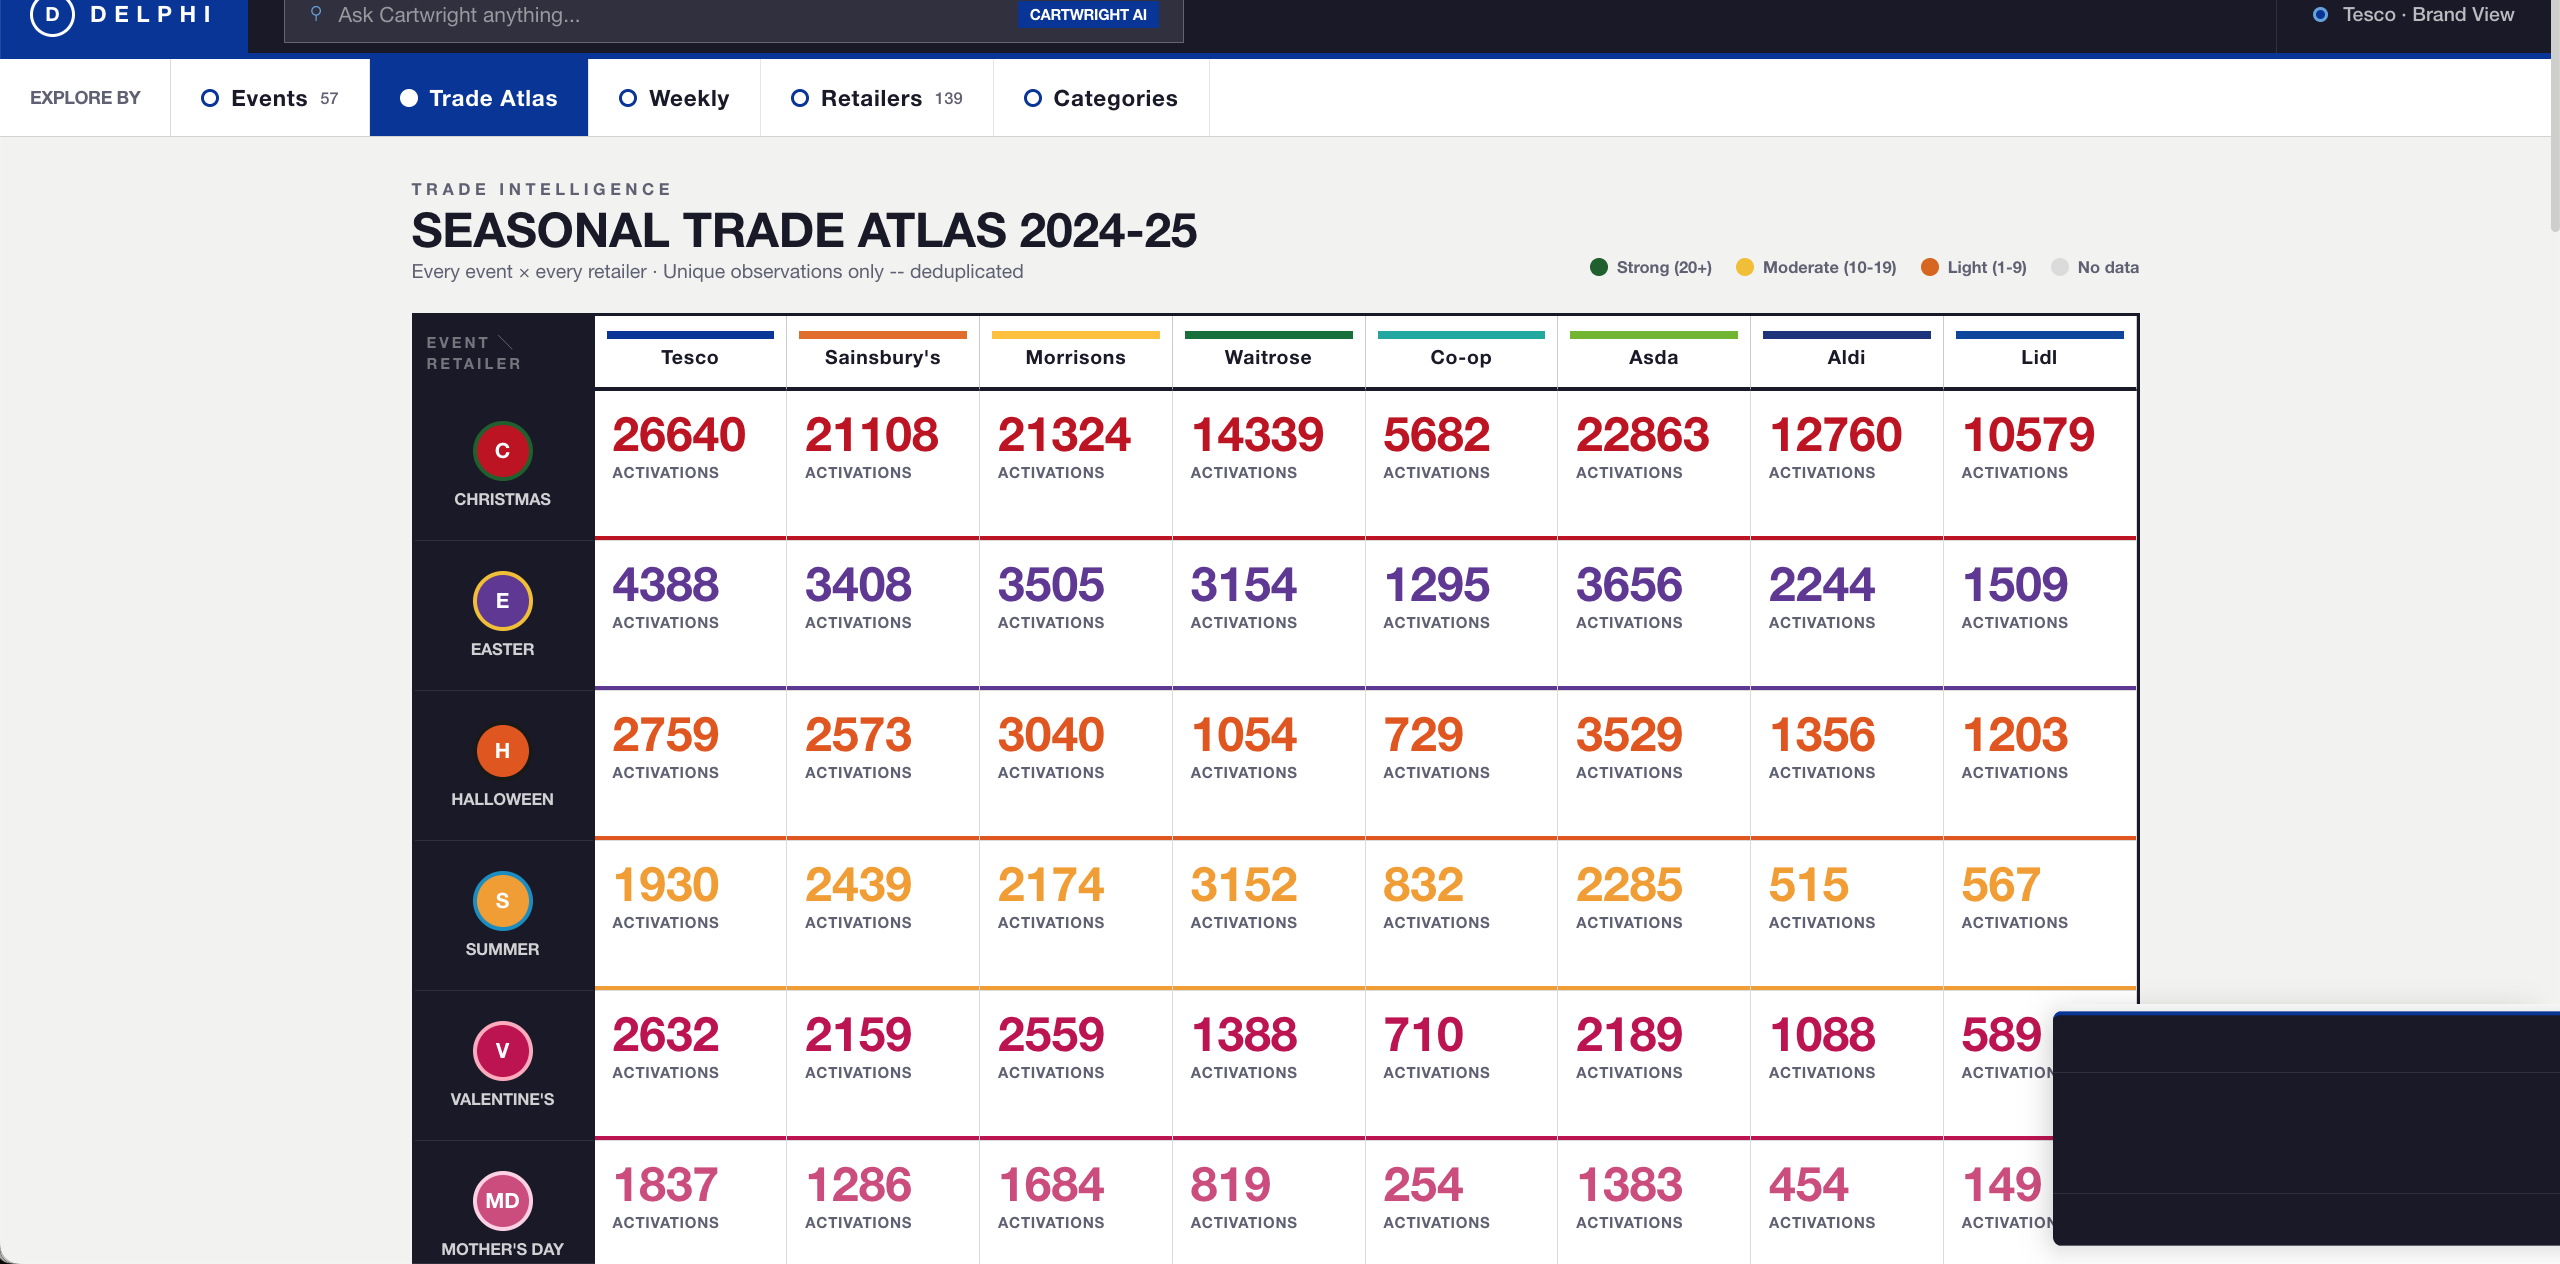
The Trade Atlas maps every event against every retailer. Deduplicated unique observations reveal who invests most in each season.
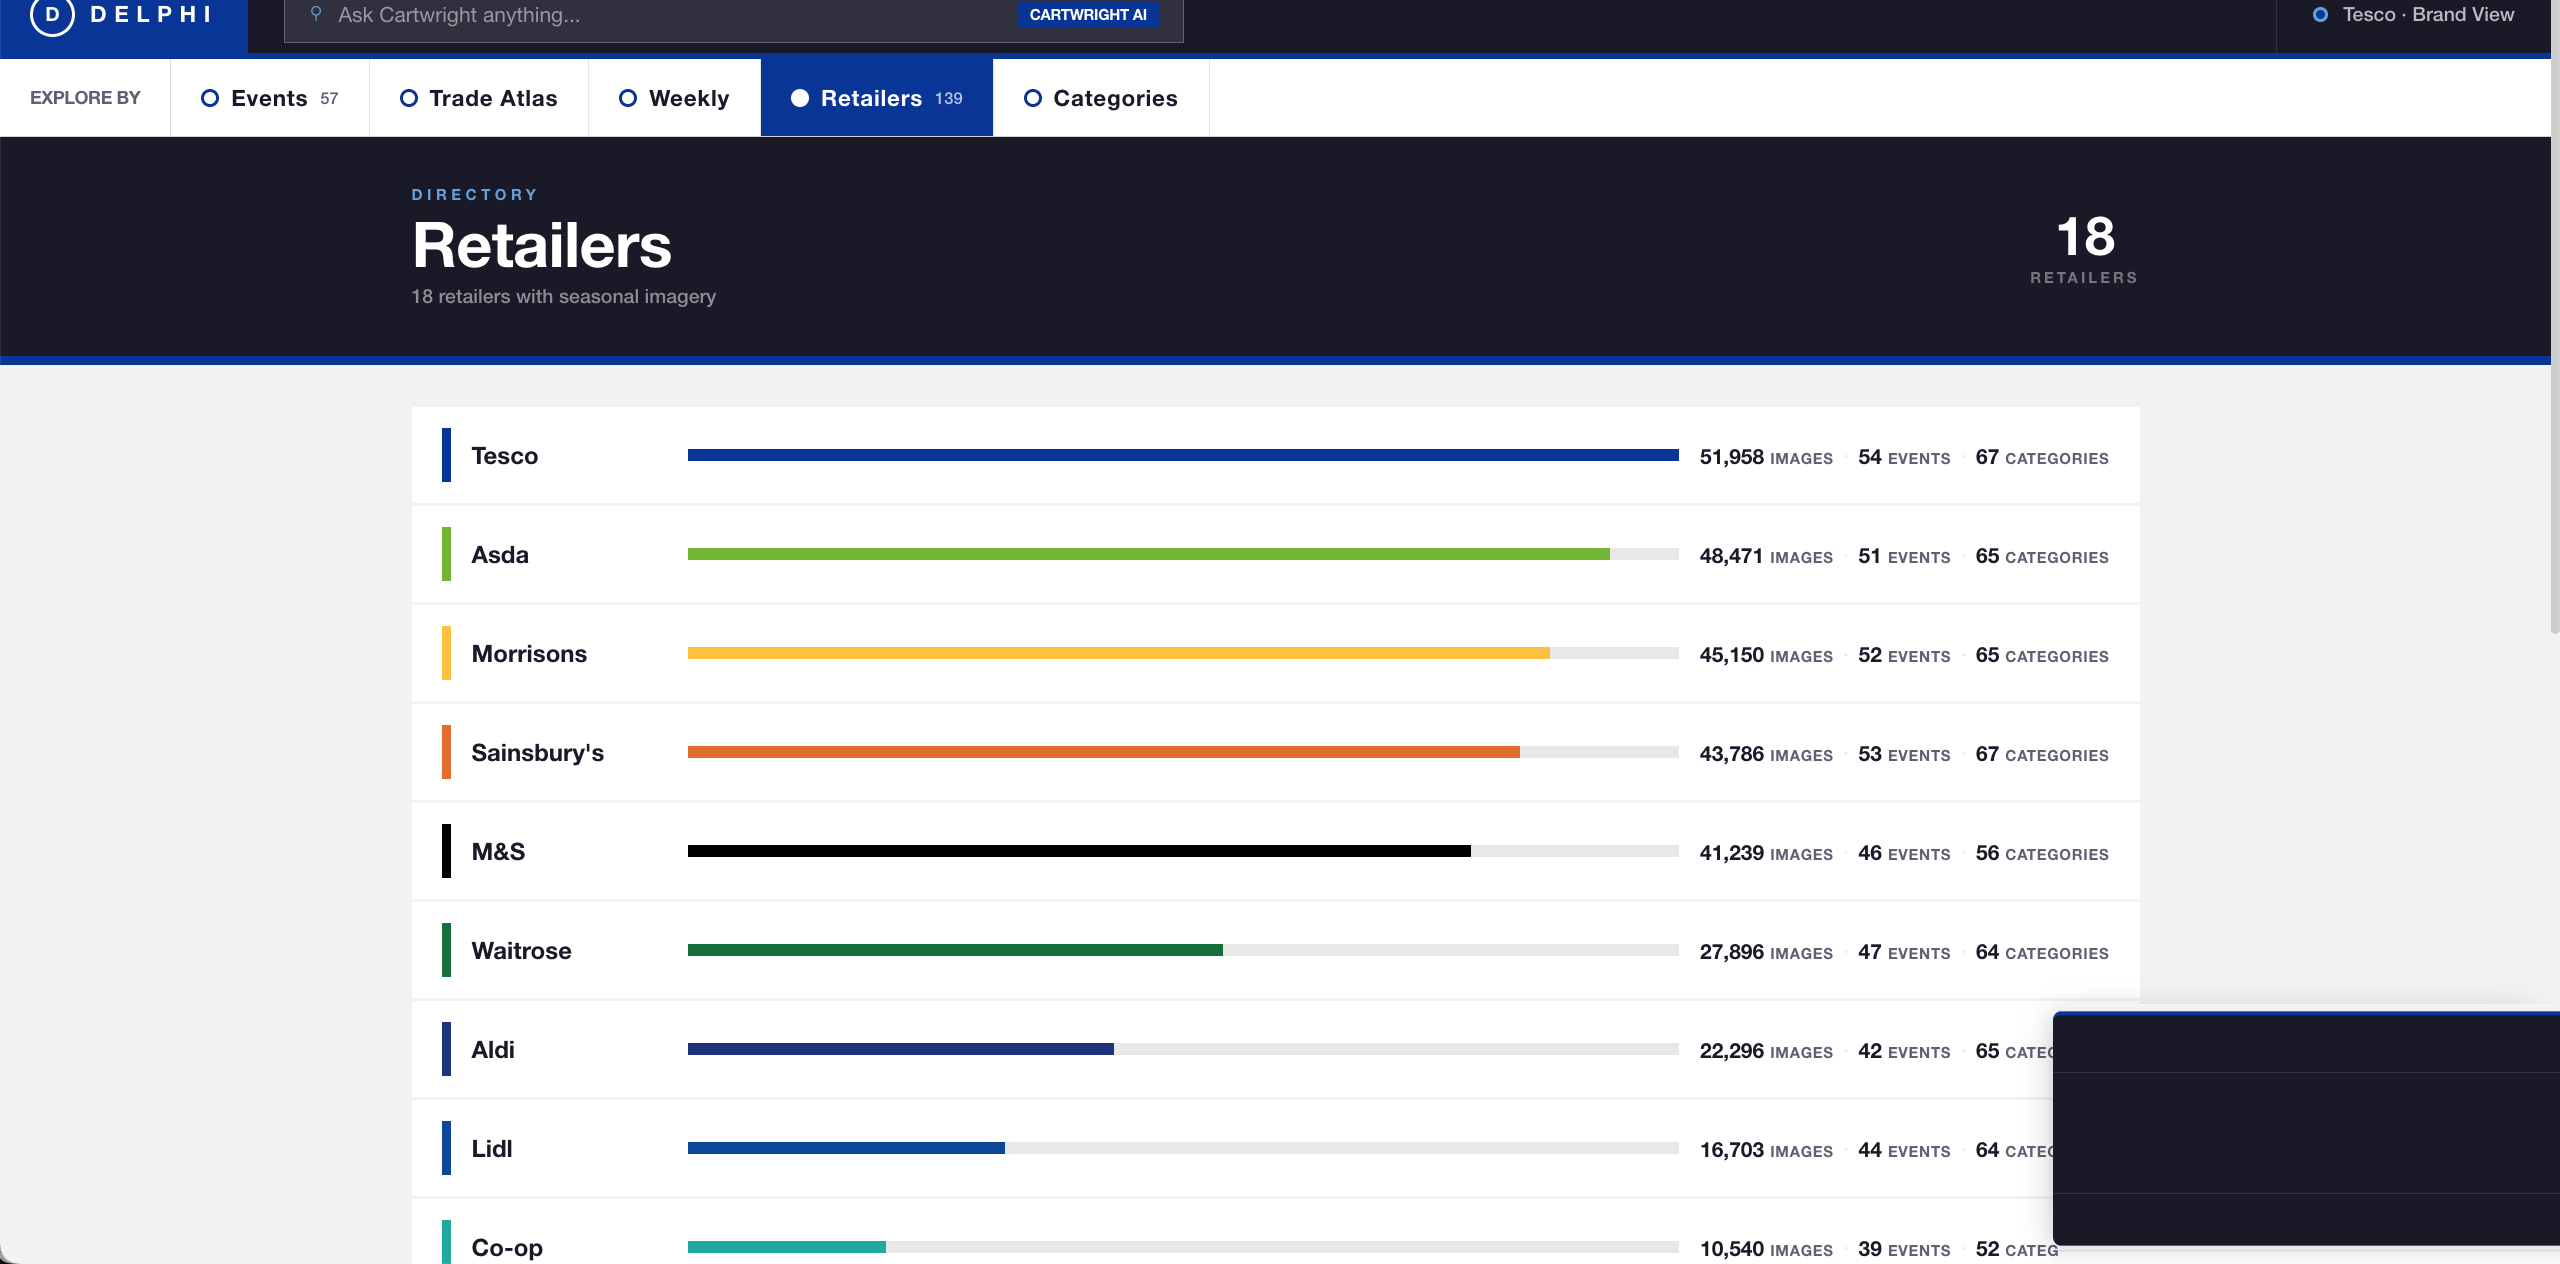
Explore 360 retailers ranked by seasonal activity. See image counts, event participation, and category coverage at a glance.
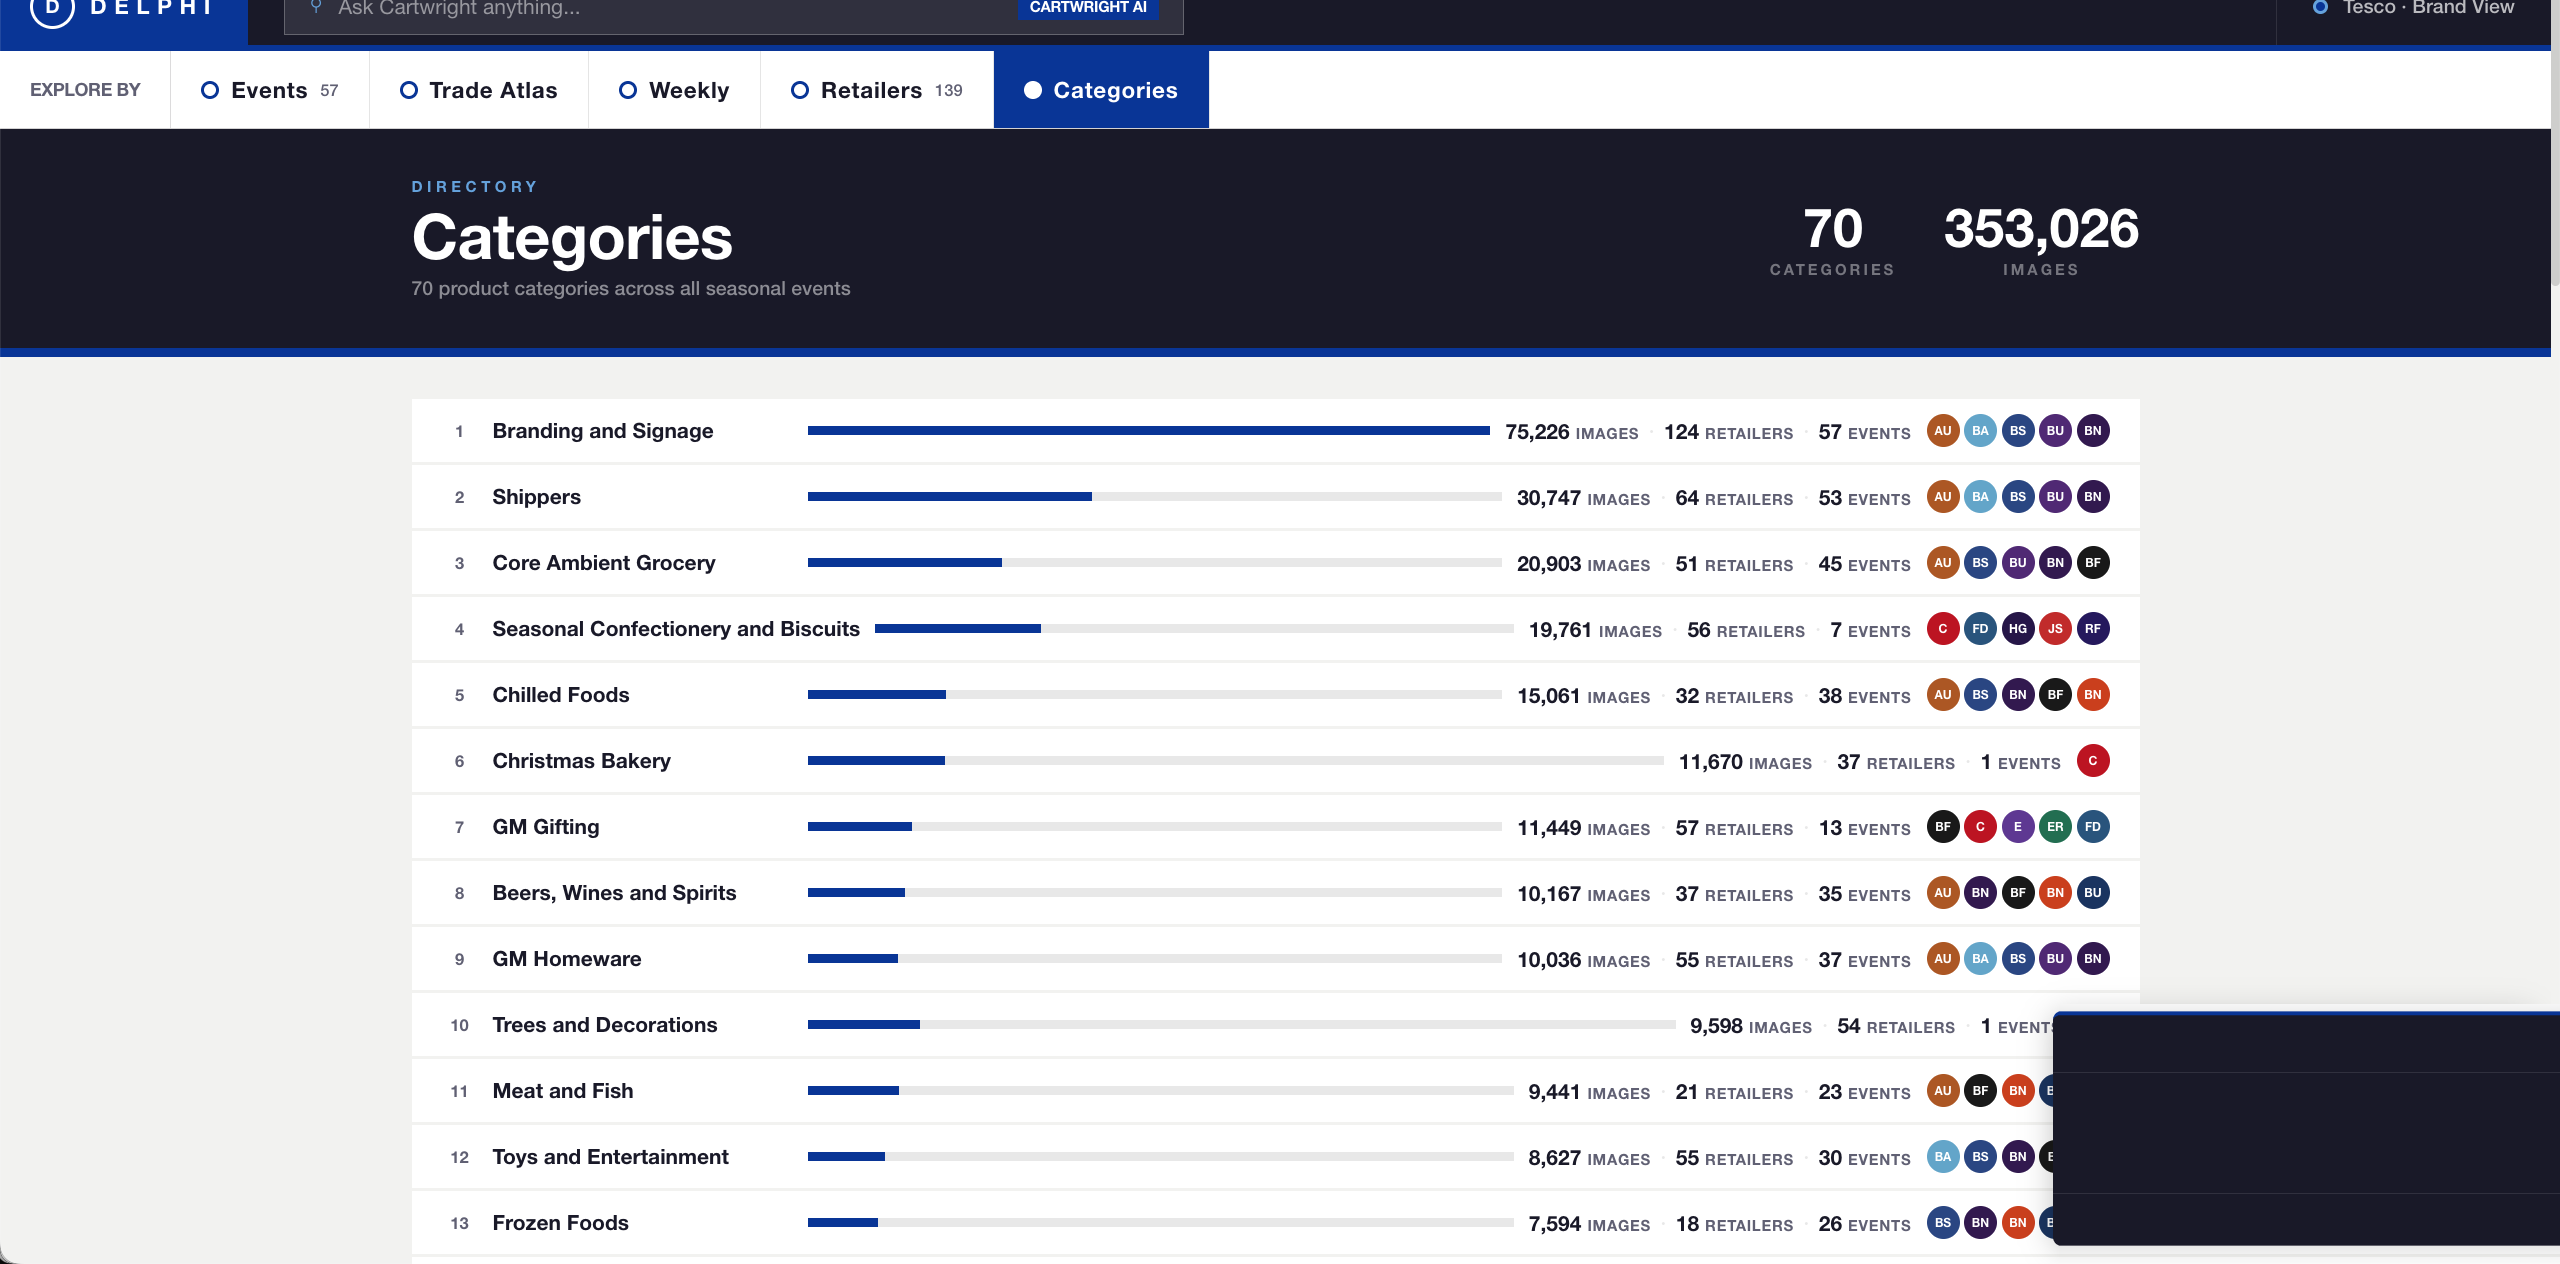
70 product categories ranked by seasonal activity. From Branding and Signage to Frozen Foods, see which categories dominate each event.
Natural language queries across 18 years of retail data. “Show me how Tesco executed Easter vs Sainsbury’s in 2024.”
See when every retailer launched every seasonal event, year by year. Spot who moved earlier, who scaled up, who pulled back.
Product mix, pricing trends, and deduplicated unique sightings across 57 events. Data from real stores, not surveys or panel estimates.
Coming Next
The same models, the same archive, applied to weekly trading. Pricing moves, ranging changes, promotional activity — captured and analysed continuously across the full million-image archive.
Lookbook
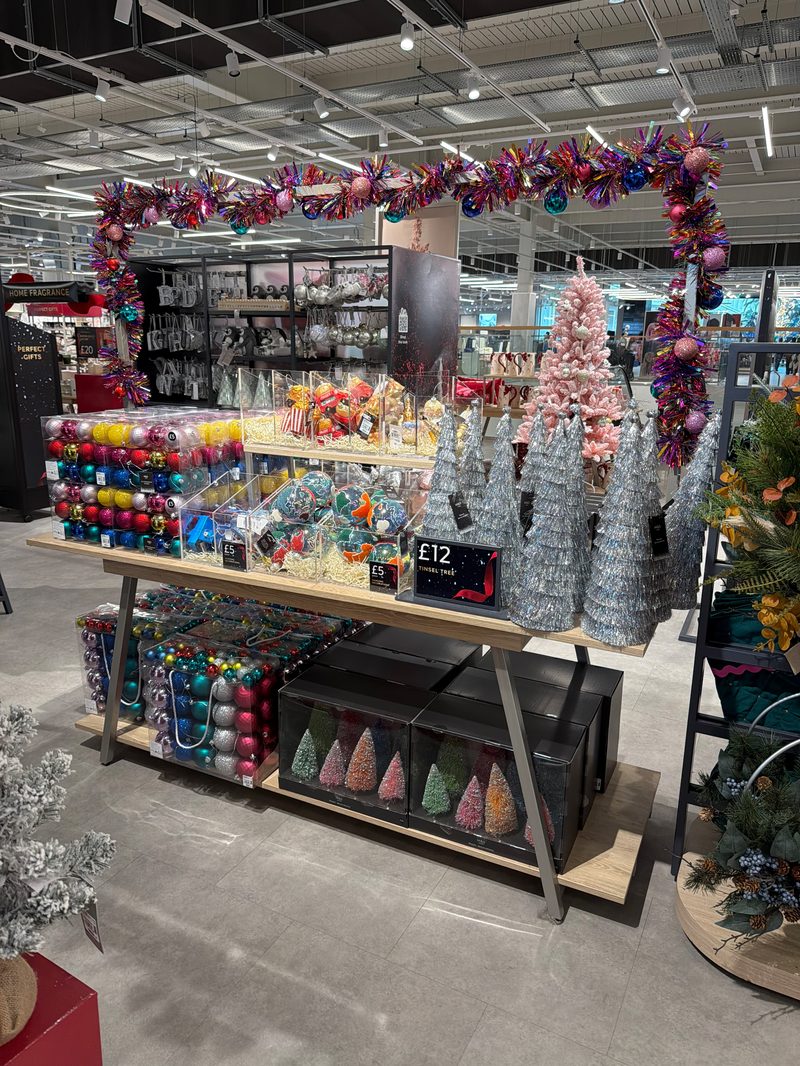
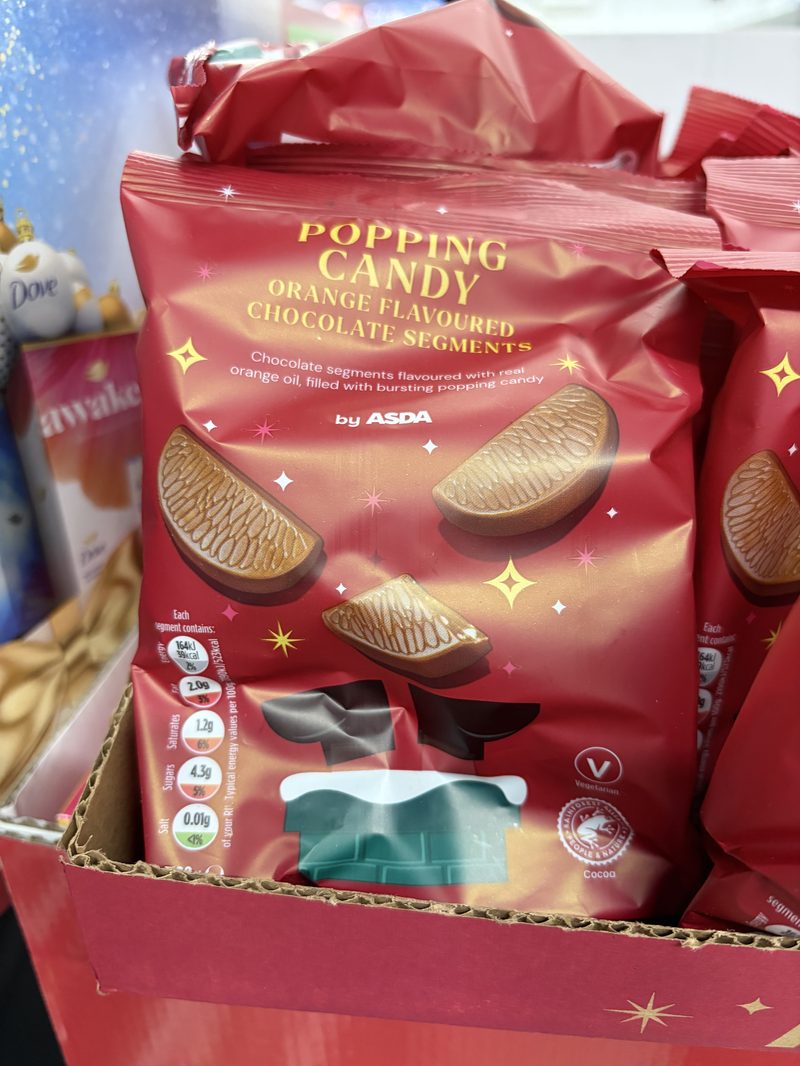
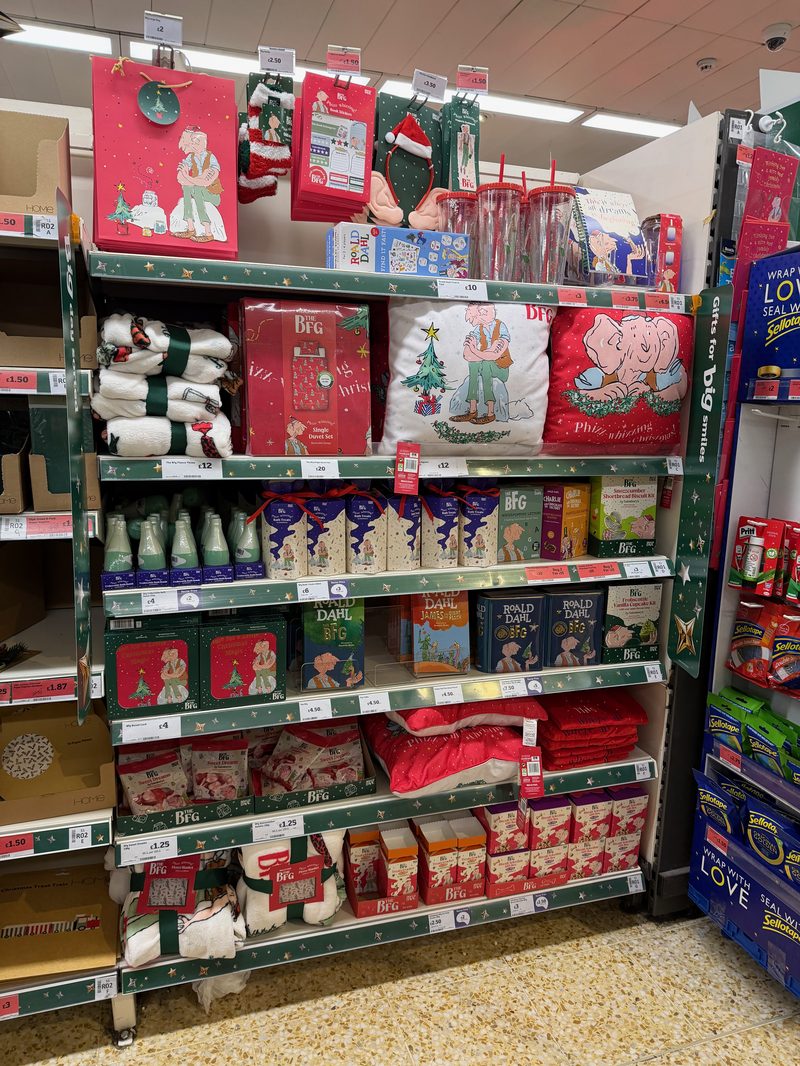
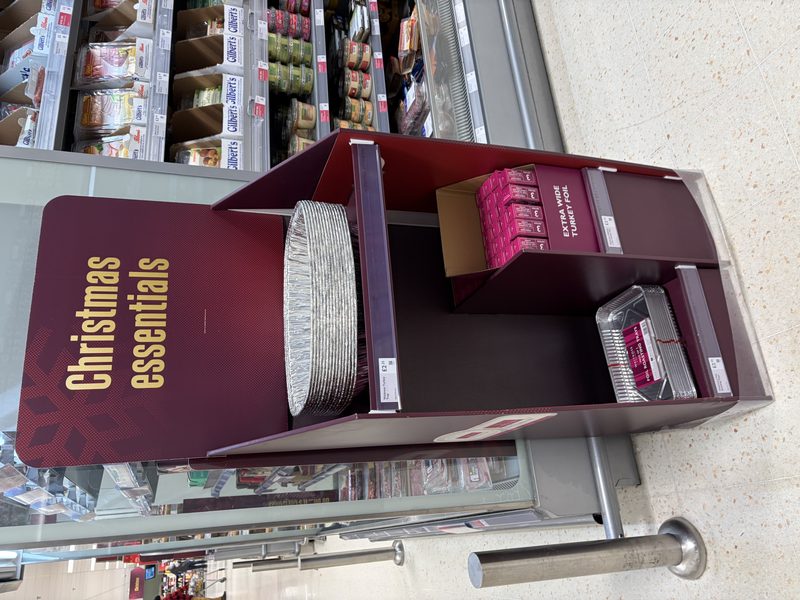
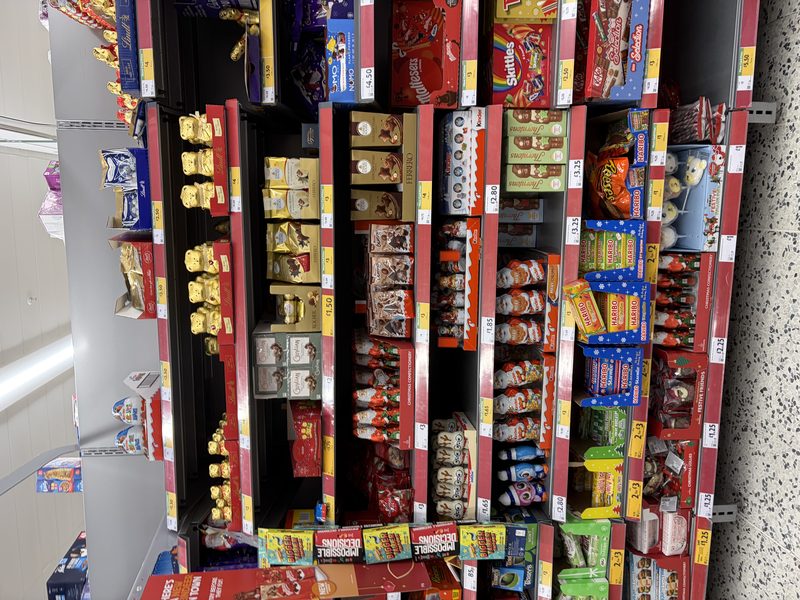
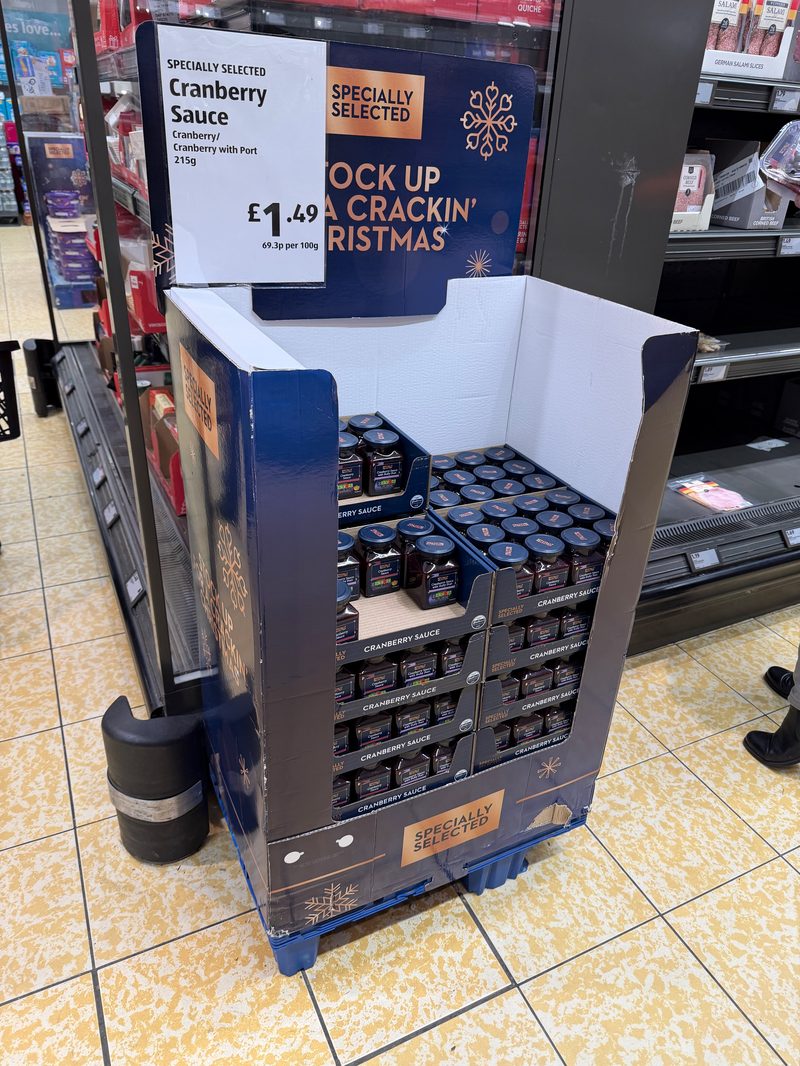
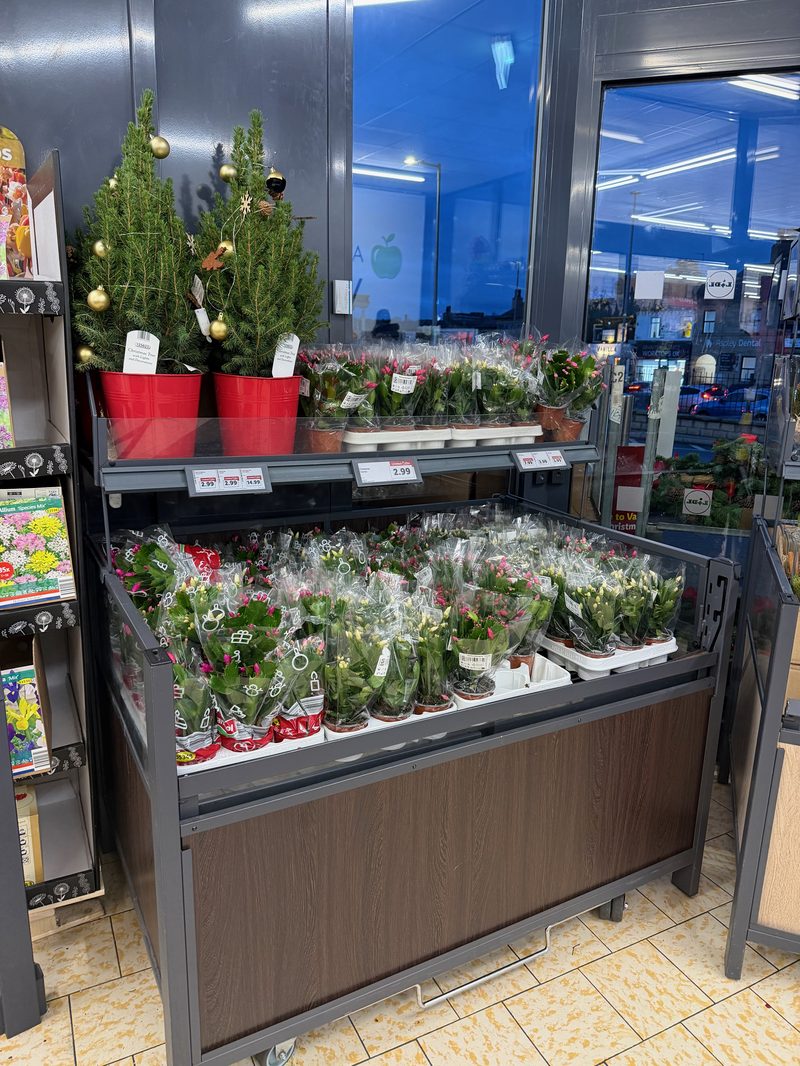
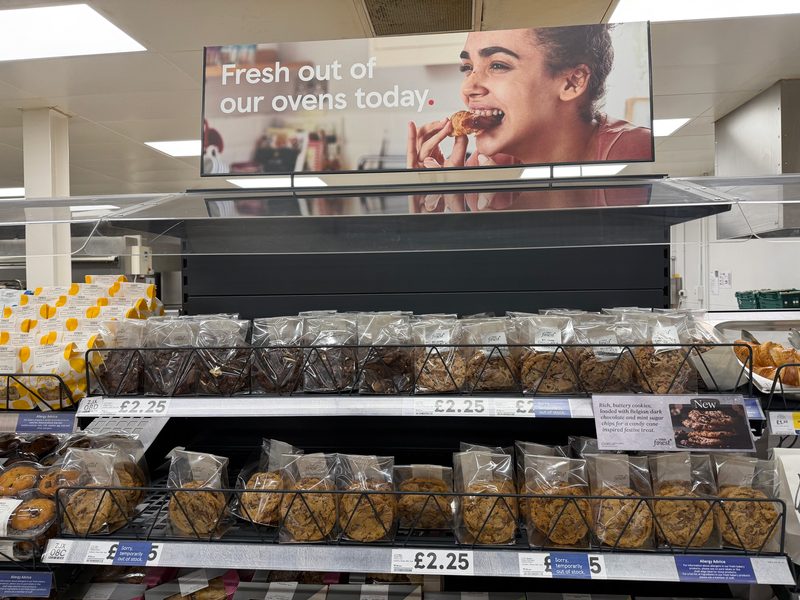
A sample of what the archive captures every week. Real photographs from real stores, taken in December 2025 across eight of the UK's largest grocery retailers.
Tesco
M&S
Asda
Sainsbury's
Waitrose
Morrisons
Aldi
Lidl
This is 8 images from one event in one week. The archive holds 364,000 seasonal images across 57 events and 18 years.
Explore the Archive →Trust
Every image passes through a proprietary privacy pipeline before it is processed or licensed. GDPR-compliant anonymisation, human-reviewed quality assurance at every stage, zero automated deletions. Privacy and data integrity are foundational, not afterthoughts.